
Designing a Passive LiDAR Detector Device - Firmware
Welcome back!
In the last post I described the process of examining the iPhone Pro TrueDepth LiDAR and developing concepts for hardware to detect it. Here I will describe the firmware for this device, the concepts employed in it, and the approaches taken to implementing these concepts on the tiny SAMD21.
Let’s start by revisiting a key point from the previous post:
“LiDAR is a Flashy Light, How Do We Measure a Flashy Light”
See a signal as light spread into beams over an area
Sense and convert those beams into analog signals
Convert the signals from analog to digital
Measure them
As it turns out, it is not just detecting a flashy light, its detecting multiple discrete beams of flashy light and differentiating them from other noise. The hardware described in the last post provides super fast digital signals from 4 discrete photodiodes. We can use those signals to perform several different measurements to differentiate the characteristics of the iPhone Pro TrueDepth LiDAR from other signal sources or noise. The firmware I designed for the device employs the following measurements:
Frequency (Goertzel):
Target 60hz and optionally harmonics at 30hz and 120hz
Note that including harmonics increases susceptibility to false positives
Pulse Repetition Frequency (PRF):
We expect the LiDAR signal to appear steady when present, with uniform edges, while things like IR Remotes are more often in bursts
Burstlikeness (Interquartile Range of Magnitude):
Again, we expect the signal to appear steady when present, so an analysis of the recent measurements is performed to judge whether they represent a steady or burstlike signal
Comparing the top and bottom quartiles of Hann Window Smoothed, detrended signal energy
I do not really understand this very well, but I web searched and StackExchanged my way through it.
Spatial Coincidence (Discrete Beams versus Wide Flood):
A record of Exponential Moving Average Peaks per channel is kept and checked to determine whether some-but-not-all sensors fired at the same time or not.
TSOP IR-Decode Veto (Sometimes Brute Force is the Elegant Solution):
Consider signal source highly unlikely to be LiDAR when remote codes are successfully decoded by the TSOP within a measurement window
Periodic Blink (Detectable Duty Cycle):
The iPhone Pro TrueDepth LiDAR seems to blink on and off in a way that is detectable, though this is less reliable as the signal is likely to move in and out of detection from simple movement by the person holding the source during a measurement window.
In order to accomplish all of this, the firmware leverages a few simple concepts to abstract and organize the measurements from the designed hardware, and analyze them in a useful manner.
Scoring System:
In order to meaningfully analyze the measurements and programmatically decide whether a given signal is or is not the sought LiDAR device, the firmware utilizes a weighted scoring system. A score greater than a given amount must be achieved within a measurement window in order to trigger a detection.
Positive detection of sought measurements such as the desired dominant frequency, some-but-not-all sensors firing within a measurement window, and others are given a positive score of some amount
Positive IR remote code decode by the TSOP would grant a significant negative score.
Measurement Bucketing (Sampling):
Measurement events are stored into fixed-time 4ms samples or “Buckets”
Ring Buffers (Fast Read, Fast Write):
Measurement samples, or “Buckets”, are written and read using ring buffers. This is fast! It needs to be fast so it doesn’t end up wasting the hardware capability.
Interrupt Driven Signal Acquisition (Fast Edge Capture):
The SAMD21 can do microsecond precision on Interrupt Timers. That’s fast and this needs fast!
Latching Hysteresis (No-Flappy Bird):
In the earlier models, I noticed the detection would either snap on and then never turn off, or be near impossible to get to stay triggered and only observable via serial output rather than via the LED signal. This was not fun, it needs to be cute and light up. To fix this, I use counters to measure:
How many positive detections have been achieved in a given period of time
How many it has not triggered in the same period of time
Based on these counts, the “detection” indicator is fired and latched when detection has been achieved long enough, and unlatches when detection has not been achieved for long enough. This prevents some false positives and helps smooth the indication of a successful detection.
That sure is a lot, and I was not familiar with a lot of it before starting this project, so allow me to go into a bit more detail about some of these concepts.
Frequency (FRE)
Before we talk about things FRE, we need to talk about math (im sorry, I didn’t like this either). To get our FRE measurement in software we need to use the Goertzel algorithm. Before we can effectively do this though, Detrending and Hann Smoothing are performed on the measured signals first.
Detrending / DC Offset Removal / whatever why are there so many names for things
What does this even mean? I had to look it up, which felt embarrassing because I do this for recording audio in a DAW but somehow did not make the connection here before looking it up, and learning about it from the audacity website of all places.
“DC offset is an offsetting of a signal from zero. On the Audacity waveform it would mean that the waveform in default view appears not to be centered on the 0.0 horizontal line, as in the upper track in this image:”
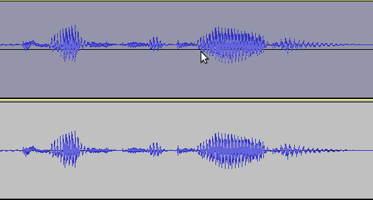
https://manual.audacityteam.org/man/dc_offset.html
This is needed to remove the DC component from the signal to prevent the 0hz baseline from interfering with measurements of the 60hz signal in the noise. I really don’t understand this well, this required a lot of recursive web searches on how to measure and analyze signals. It seems like it works, but my understanding of it is pretty shallow.
To do this, mean removal is performed, which sounds positive! Mean removal (detrending) is done in most simple way by computing the average of all samples in the window then subtracting that from every sample, like so:
float mu = 0.0f;
for (int i=0; i<N; i++) {
 mu += prep[i];
}
mu /= N;
for (int i=0; i<N; i++) {
 prep[i] -= mu;
}
After detrending, Hann Smoothing is applied to the measurement.
Hann Smoothing
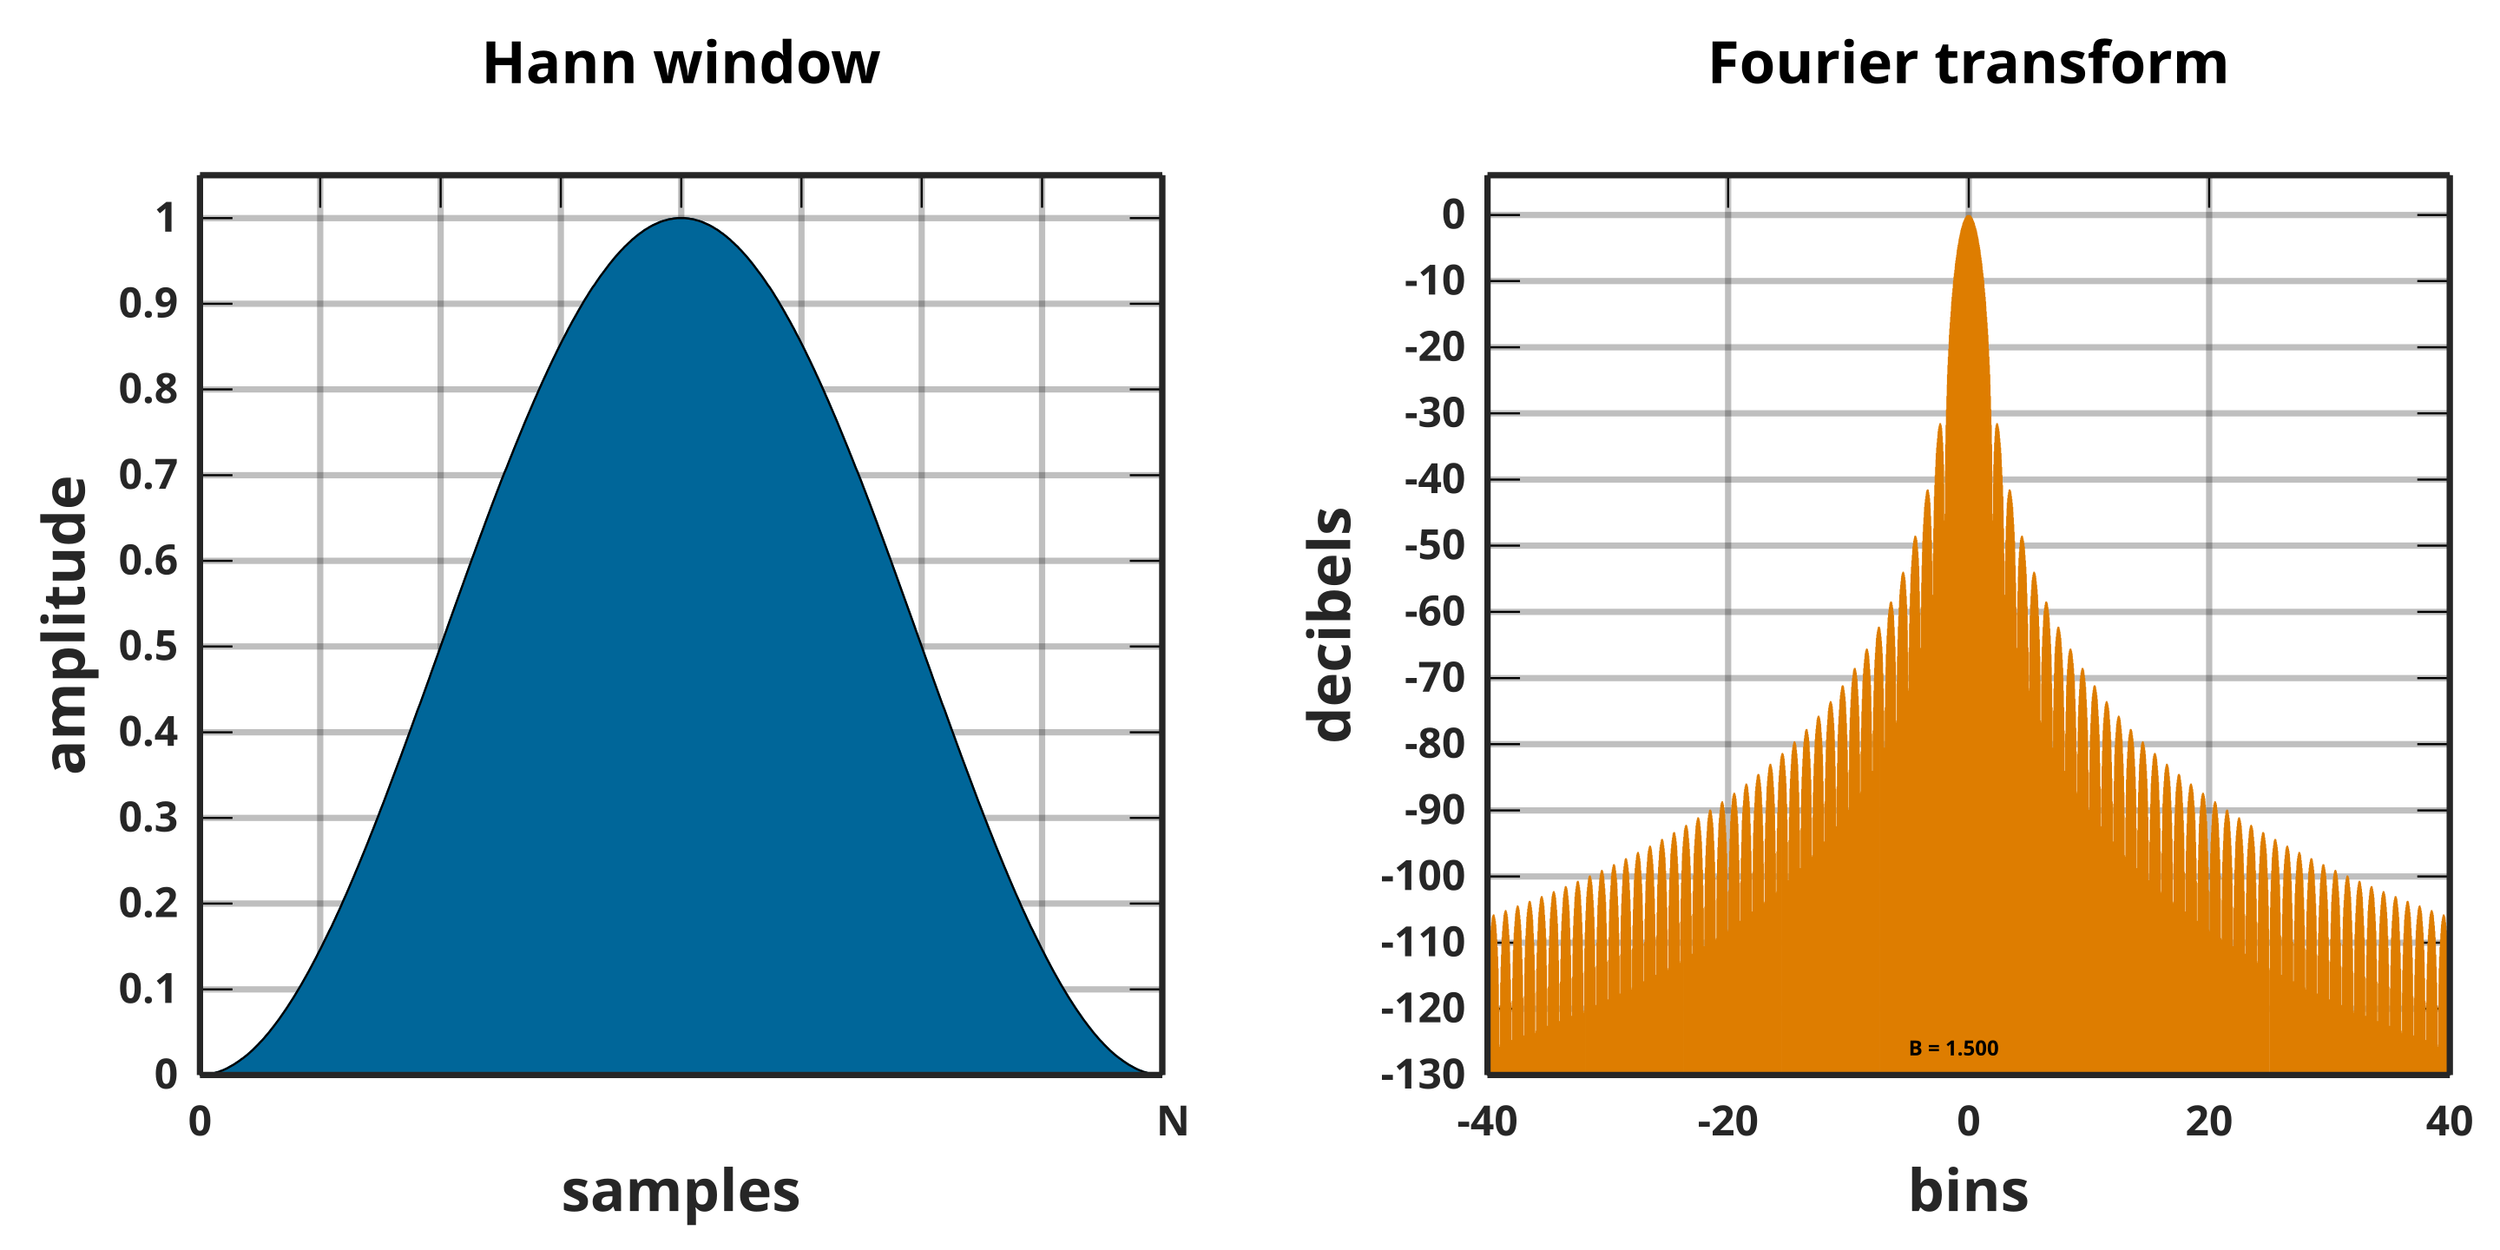
Illustration Hann Smoothed Fourier Transform
Again, I do not really understand this, but based on all the web searches, Hann Smoothing is a means to smooth out a signal waveform to be tapered and smooth instead of wacky and jagged. The device performs the Hann Smoothing on the current window being analyzed, after mean removal, and before performing Goertzel. This is so the edges in the observed window have smooth tapers without spikes which would leak into neighboring frequencies and hinder measurement. Without Hann Smoothing, detection is super jumpy and really hard to get successful detection. With Hann Smoothing, the dominant bins are much more clearly defined.
Here's the thing, I'm not a scientist or a software developer, I’m just a hacker. I had to web search my way through a whole lot of this. This is apparently how you do it in C.
for (int i=0; i<N; i++) {
  float w = 0.5f * (1.0f - cosf(2.0f * PI * i / (N - 1)));
  prep[i] *= w;
}
It’s that simple!? Apparently! After having performed mean removal and Hann over the current Analysis Window, the device uses the Goertzel algorithm to locate which frequencies are the strongest!
Goertzel? I hardly knoewrel!
A Goertzel Filter is a means to filter the S from the N in SNR which can be performed in software[1][2][3][4][5]. In this case, the device has four photodiodes receiving a bunch of photons and creating a bunch of signals and the microcontroller is recording every time this happens. This is a lot of noise. The device is looking for a specific frequency in this signal, specifically 60hz and optionally its harmonics (30hz, 120hz, etc). This will tell us what the strength of 60hz or its harmonics are in the observed signal, and it is fairly easily done in C, as demonstrated by this example from StackExchange.
float goertzel_mag(int numSamples,int TARGET_FREQUENCY,int SAMPLING_RATE, float* data)
{
    int     k,i;
    float   floatnumSamples;
    float   omega,sine,cosine,coeff,q0,q1,q2,magnitude,real,imag;

    float   scalingFactor = numSamples / 2.0;

    floatnumSamples = (float) numSamples;
    k = (int) (0.5 + ((floatnumSamples * TARGET_FREQUENCY) / SAMPLING_RATE));
    omega = (2.0 * M_PI * k) / floatnumSamples;
    sine = sin(omega);
    cosine = cos(omega);
    coeff = 2.0 * cosine;
    q0=0;
    q1=0;
    q2=0;

    for(i=0; i<numSamples; i++)
    {
        q0 = coeff * q1 - q2 + data[i];
        q2 = q1;
        q1 = q0;
    }

    // calculate the real and imaginary results
    // scaling appropriately
    real = (q1 - q2 * cosine) / scalingFactor;
    imag = (q2 * sine) / scalingFactor;

    magnitude = sqrtf(real*real + imag*imag);
    return magnitude;
}
https://stackoverflow.com/questions/11579367/implementation-of-goertzel-algorithm-in-c
In the LiDAR Detector firmware, this filtering is used to check the power at a specific target Hz - Goertzel Power!
static float goertzel_power(const float* x, int N, float targetHz, float fs){
  float kf = (N * targetHz) / fs; // bin index fraction
  int k = (int)(kf + 0.5f); // nearest
  if (k <= 0 || k >= N-1) {
    return 0.0f;
  }
  float w = 2.0f * PI * k / N;
  float c = 2.0f * cosf(w);
  float s0 = 0;
  float s1 = 0;
  float s2 = 0;
  for (int i = 0; i < N; i++) {
    s0 = x[i] + c*s1 - s2; s2=s1;
    s1=s0;
  }
  float P = s1*s1 + s2*s2 - c*s1*s2;  // power!
  return ( P > 0 ) ? P:0;
}
The device checks if the 60Hz bin (an optionally other bins, such as the harmonics mentioned earlier) is strong and stable (dominant).
// find in 30, 60, 24, 50, or 120Hz
float topP = 0
float runnerP = 0;
int topIdx = -1;
for (int i=0;i<FRE_BINS_N;i++) {
  float p = goertzel_power(prep, N, FRE_BINS_HZ[i], MICRO_FS); // Goertzel Power!
  if (p > topP) {
    runnerP=topP;
    topP=p;
    topIdx=i;
  } else if (p > runnerP) {
    runnerP=p;
  }
}
float dom = (runnerP>0)? topP/runnerP : (topP>0?1e9f:0.0f);
if (topIdx>=0 && dom>=FRE_DOM_RATIO) {
  freScore = SCORE_FRE;
}
By adjusting the interval of the buckets during which the powers of bins are checked within the sliding window, I tuned to filter for a consistently above-threshold 60hz bin from noise. In testing, the sweet spot for this seems to be 4ms intervals over a 200ms sliding window.
Burstlikeness (BUR)
IR remotes will appear "bursty" (or "spurty" according to one LLM, which I chose to include here), and signals from things like LiDARs are likely to look steadier within a duty cycle. I wanted to pursue measuring everything I could that would be different between the LiDAR signal and everything else, so I also recursively web searched how to measure this and how to do it in C.
Using the same detrended and Hann smoothed Analysis Window as is used for FRE, we make a "histogram" (I thought that was just in TS-100) and then we do Interquartile Range of Magnitude[6] analysis. Based on my understanding of this, what we want to do is:
Determine what the 25th and 75th quartiles are
Average together the samples greater than the 75th quartile
Average the samples that are less than the 25th quartile
Divide the former by the latter.
In C this is not so complicated, as illustrated here.
burstRatio = average(samples_greater_than_Q3) / average(samples_less_than_Q1)
Wow, that was easy! With an "understanding" of how to do such a thing, and after some more recursive web searching about how to do such a thing in C, I come up with a big mess! The device uses the math to compute a burstRatio, then compares it to a value, BURST_RATIO_NEED, which I still am not sure what the just-right value is, and then scores it. Look at this caveman-code / StackExchange / LLM-solution amalgam:
// prep[] after detrend + Hann-window of current window

// min/max for histogram
float mn = prep[0];
float mx = prep[0];
for (int i=1; i<N; i++) {
  if (prep[i] < mn) {
    mn = prep[i];
  }
  if (prep[i] > mx) {
    mx = prep[i];
  }
}

// build histogram
const int HB = 16;
int hist[HB] = {0};
if (mx == mn) {
  return 0;
} else {
  for (int i=0; i<N; i++) {
    int b = (int)((prep[i] - mn) * (HB - 1) / (mx - mn));
    if (b < 0) {
      b = 0;
    } else if (b >= HB) {
      b = HB - 1;
    }
    hist[b]++;
  }
}

// find q1 and q3 in historgram
int q1T = N / 4;
int q3T = (3 * N) / 4;
int acc = 0;
int q1Idx = 0;
int q3Idx = HB - 1;

for (int b = 0; b < HB; b++) {
  acc += hist[b];
  if (acc >= q1T) { q1Idx = b; break; }
}
acc = 0;
for (int b = 0; b < HB; b++) {
  acc += hist[b];
  if (acc >= q3T) { q3Idx = b; break; }
}

// convert bin index to threshold
float q1 = (mx > mn) ? (mn + (mx - mn) * (q1Idx / (float)(HB - 1))) : mn;
float q3 = (mx > mn) ? (mn + (mx - mn) * (q3Idx / (float)(HB - 1))) : mx;

// averages of quartiles
float sumLo = 0;
float sumHi = 0;
int cntLo = 0;
int cntHi = 0;
for (int i = 0; i < N; i++) {
  float a = fabsf(prep[i]);
  if (prep[i] <= q1) {
    sumLo += a;
    cntLo++;
  }
  if (prep[i] >= q3) {
    sumHi += a;
    cntHi++;
  }
}

// compare observed ratio to limit and score
float burstRatio = 0.0f;
if (cntLo > 0 && cntHi > 0) {
  float meanLo = sumLo / cntLo;
  float meanHi = sumHi / cntHi;
  burstRatio = (meanLo < 1e-6f) ? ((meanHi > 0) ? 1e9f : 0.0f) : (meanHi / meanLo);
}
int burstScore = (burstRatio >= BURST_RATIO_NEED) ? SCORE_BURST : 0;
Pulse Repetition Frequency (PRF)
“The number of pulses of a repeating signal in a specific time unit.”
https://en.wikipedia.org/wiki/Pulse-repetition_frequency
I had thought this would be like the duty cycle or effect a spinning LiDAR might produce. To my chagrin, PRF is different apparently. It is happening on a tiny timescale whereas the flashes or blinks from a spinning LiDAR or duty cycle are near seconds in timescale, apparent to the pathetic human eye. This would be observed as some kind of variance or lack thereof in the signal over time rather than perceived with our mortal eyes.
The device collects all the timestamps of the edge interrupt fires for a given analysis window. This allows it to enumerate all inter-pulse intervals from that window. the device also merges all four channels into one signal for this purpose as the structure of the light isn’t important for this part. Then it does some math again (I’m sorry, there is so much math in this and I had to look it all up because I went to business school), to convert the intervals into frequencies and store them in a buffer.
Then, even MORE math! It computes PRF and coefficient of variation from these buffered interval frequency values and compares this to a predefined value representing the desired threshold of tightness of variation or PRF. The more stable this value, the higher likelihood the signal is a LiDAR.
I had to look up a lot to figure out how to do this in C, and again, I am a hacker and not a developer, so no guarantee this is written efficiently or even well:
// edge interrupt timestamps for window
float freqs[MAX_PULSES];
float int nf=0;
for (int i=1; i<nEdges; i++){
    float dt = (edges[i].t - edges[i-1].t) * 1e-6; // seconds
    if (dt > 1e-6 && dt < 5e-3) { // 200khz to 200hz
        freqs[nf++] = 1.0f / dt; // hz
    }
}

// compute mean PRF and CV
float sum = 0;
float sum2 = 0;
for (int i = 0; i < nf; i++) {
  sum += freqs[i];
  sum2 += freqs[i] * freqs[i];
}
float mean = sum / nf;
float var = (sum2 / nf) - mean * mean;
float sd = sqrtf(fmaxf(var, 0));
float cv = ( mean > 1e-3 ) ? (sd / mean) : 1.0f;

// award score
int prfScore=0;
if (nf >= MIN_PULSES && mean >= 5e3 && mean <= 40e3 && cv <= 0.10) {
    prfScore = +3;
}
Spatial Coincidence (SPAT)
Normal light sources look like a single light source to sensors like photodiodes and such. When you point something like a computer monitor or TV remote at an IR sensor, or in this case array of IR sensors, it is likely all of the sensors will see this same source at once. As I described previously, the LiDAR source on the iPhone Pro is projecting a lattice of dots, something more like focused beams than a wide spreading light source.
Because of this, looking directly at the LiDAR source from a moderate distance would be more like looking into a projector in just the right places to be in and out of the blinding light it emits. Move left and be blinded, move right and be able to look directly at the emitter without seeing signal. This nature allows the device to differentiate LiDAR-likely signal sources from the riffraff (noise)! It treats a single sensor edge in a time frame as poor likelihood, or all sensors firing an edge in the same time frame as poor likelihood, and 2-3 senors firing an edge in a time frame as a high likelihood.
The device records the edge timestamps for each sensor, and for a given analysis window compare whether any senors fired within the same time frames as one another. We check the coincidence count per time frame, and when there are 2 or more but less than ALL, it awards a positive score. The device optionally awards a negative score when zero, one, or all sensors fire within a given time frame.
TSOP IR-Decode (Veto)
Even though the device is looking for a 60hz signal, and we are filtering for 940nm IR at the hardware level, we still run into a few common false positive cases. TVs are often 60hz or 120hz, light bulbs in the united states are around 60hz over AC apparently, and IR remote controls seem to be commonly right around 60hz. At the very least, IR remote code signals can be easily vetoed since they can be very easily detected with high confidence. For this part, I wrote basically no code and just borrowed an Arduino library that decodes IR remote signals off TSOP1738s:
#include <IRremote.hpp> // yolo
static uint16_t tsop_remote_frames = 0;
static uint32_t tsop_window_start_ms = 0;

static int scoreTSOP() {
  uint32_t now = millis();
  if (tsop_window_start_ms == 0) {
    tsop_window_start_ms = now;
  }
  if (now - tsop_window_start_ms >= TSOP_WINDOW_MS) {
    tsop_remote_frames = 0;
    tsop_window_start_ms = now;
  }
  return (tsop_remote_frames > 0) ? -3 : 0;
}
// In loop()
while (IrReceiver.decode()) {
  if (IrReceiver.decodedIRData.protocol != UNKNOWN) {
    tsop_remote_frames++;
  }
  IrReceiver.resume();
}
// at score time
int TSOP_Score = scoreTSOP();
Periodic Blink (Detectable Duty Cycle)
I am still working to understand how best to implement the two methods suggested by web searching for detecting this aspect of the signal; Binary Autocorrelation to detect Strong Periodic Signals, and Run-length Analysis to detect consistent duty-cycle measurement.
The device performs these analyses on the combined binary energy stream derived from per-bucket energy for measuring PRF. The main issue is that this analysis takes place over a much longer time frame. The target device would need to be still and observed for much longer than for say spatial coincidence or frequency analysis, and so is less valuable a measurement. Since the analysis is less valuable, spending the processing power to perform it may not be worthwhile.
Ring Buffers, Windows, Buckets
The device uses ring buffers to very quickly store and read raw, processed, and analyzed measurements. Small measurements from given time divisions, Buckets, are collected for a given measurement window. This organization of data allows the device to maintain a sliding window of measurement and analysis while maintaining some state of known past measurements.
Interrupt Drive
The device needs to be able to do signal processing and do it fast in order to take advantage of the speed of the sensors. The SAMD21 has a 48mhz CPU which handles its interrupt pins. This is super fast. The device drives on interrupts to measure the signals from the sensor channel circuits so it can go as fast as possible on the software side.
Hysteresis / Latching
The device does some hysteresis (I learned this new word just for this project) around the triggering of detection (score threshold surpassed) and the triggering of un-detection (score threshold not passed).
As described earlier, the device maintains two sliding window counts of how many measurements in a given period of time have resulted in a score above the threshold, and how many have not. When the number of positive triggers above the threshold is above yet another threshold, the device will indicate. Once there have been a given number of measurements which have not resulted in a score above the threshold in a given window, the device will cease to indicate.
Demos
Here are a couple videos of Proof of Concept devices for the Op-Amp and Schmitt Trigger versions of the hardware design in action!
In each video, the prototype device can be seen in the middle of the frame, and the LiDAR source (an iPhone 15 Pro) is visible in the foreground in the lower third of the frame. The dot grid lattice projected by the LiDAR source is visible as dots flashing off and on against the visible surface. A blue LED is visible, flashing rapidly, indicating serial transmission. Serial output from the device can be seen as scrolling text overlaid over the frame.
This text includes measurement and score information live from the prototype device. In the videos, the LiDAR source is initiated (the iPhone camera app is opened) and shortly thereafter another blue LED is lit, indicating the device has detected a TrueDepth LiDAR signal. During this moment, the text displayed on the screen indicates the device has awarded a high enough score between FRE, SPAT, and Burst, and a low enough score from TSOP to trigger detection indication.
Op-Amp+Comparator Proof of Conept LiDAR Detector
Schmitt Trigger Proof of Conept LiDAR Detector
There is still a lot that can be improved, both in which components could be used as well as firmware tuning. Overall, I am quite pleased with the results even as rough as they are. This has been a lot of fun and I learned a lot of things that have already come in handy for other endeavors.
Thanks for reading!
Greets to Samy Kamkar for inspiring me to try this. Thank you, Samy!
JFIO gang r%! Learning is fun! Knowledge is power! Hack The Planet!
Appendix I
https://www.st.com/resource/en/design_tip/dt0089-the-goertzel-algorithm-to-compute-individual-terms-of-the-discrete-fourier-transform-dft-stmicroelectronics.pdf
https://en.wikipedia.org/wiki/Goertzel_algorithm
https://en.wikipedia.org/wiki/Discrete_Fourier_transform
https://www.reddit.com/r/AskElectronics/comments/g5vrio/how_to_calculate_rc_values_to_remove_dc_offset/
https://en.wikipedia.org/wiki/Hann_function
https://en.wikipedia.org/wiki/Interquartile_range
Appendix II
Prior Art
These are patents I could find which seem to have to do with the detection of LiDAR systems. None of these seem to detect TrueDepth LiDAR though.
US 5,666,120 A / US 5,990,821 A – “Detector apparatus.”
automotive radar/laser detector with a laser (LIDAR) photodiode front-end and lens array
US 6,670,905 B1 – “Radar warning receiver with position and navigation information.”
A radar detector explicitly includes a laser detector “for detecting police LIDAR signals,” integrating GPS.
US 2020/0041622 A1 – “Detecting and tracking LiDAR cross-talk.”
Methods to sense and classify external LiDAR sources (e.g., other vehicles) using a passive channel and timing correlation—functionally
US 2020/0158825 A1 – “Interference detection and mitigation for LiDAR systems.”
detect external LiDAR interference and mitigate it
US 11,899,110 B2 (and related) – “Techniques for detecting cross-talk interferences in LiDAR imaging sensors.”
Detects external LiDAR by analyzing temporal patterns/cross-talk
US 2020/0073531 A1 – “Detection of structured light for depth sensing.”
Focused on detecting structured-light patterns (e.g., dot projectors) with cameras